Friday, January 23, 2015

Most Useful JVM arguments


Most of us know these commands or arguments. Still wanted to collect and have it in Single place.

Check a java process status
ps –ef | grep java or
jps
Check java application status by specifying application status
jps –lv | grep <app name>
Example jps –lv | grep managed
To know about java process information including arguments
jinfo <PID> <-d64>
-d64 is required when java process is running on 64 platform
To get stack trace or thread dumps
jstack < PID >
It can be redirected to an output file
To get heap dump for memory issue analysis
jmap -dump:live,format=b,file=heap.bin <pid>
Generating a heap in production environment is not recommended. So can capture only historical data using,
jmap -histo:live  <pid> >> filename.txt
To understand what each thread is doing at the time of a crash
Jdb
ptree – to known the process tree- can view parent processes

Useful Java parameters
Some options may vary per architecture/OS/JVM version. Boolean options are turned on with -XX:+<option> and turned off with -XX:-<option>. Numeric options are set with -XX:<option>=<number>. Numbers can include 'm' or 'M' for megabytes, 'k' or 'K' for kilobytes, and 'g' or 'G' for gigabytes (for example, 32k is the same as 32768). String options are set with -XX:<option>=<string>, are usually used to specify a file, a path, or a list of commands
Set Heap Size
 Xms<size>, Xmx<size>,
Sizing Young Generation
Xmn<size>
XX:MaxNewSize=size
PermSpace sizing
-XX:MaxPermSize=64m
Size Thread Stack size
-XX:ThreadStackSize=512
Print GC details
-Xloggc:<filename>            Log GC verbose output to specified file. The verbose output is controlled by the normal verbose GC flags.
-XX:-UseGCLogFileRotation             Enabled GC log rotation, requires -Xloggc.
-XX:NumberOfGClogFiles=1
-XX:GCLogFileSize=8K
-XX:-PrintGC      Print messages at garbage collection. Manageable.
-XX:-PrintGCDetails         Print more details at garbage collection. Manageable. (Introduced in 1.4.0.)
-XX:-PrintGCTimeStamps             Print timestamps
GC algorithm
Parallel GC- New and old generation
XX:+UseParallelGC,X:+UseParallelOldGC,XX:ParallelGCThreads=24
G1 GC
-XX:+UseG1GC -XX:G1ReservePercent=n -XX:G1HeapRegionSize=n
Concurrent GC –Old Generation
-XX:-UseConcMarkSweepGC -XX:ConcGCThreads=n
Disable Explicit Garbage collection
-XX:-DisableExplicitGC

Tuesday, June 23, 2009

Cache Management in Java Applications

Cache Management in Java Application
IntroductionAn increasing the volume of business critical data leads to new challenges when we are developing an application with Java. The applications data is stored in data sources like database or legacy file system.
Frequent access for a same object is an overhead for an application’s performance. An application may slow down or even crash if it receives more simultaneous requests. Caching mechanism may address these challenges.
This article explains the ways for improving performance, concurrency and scalability in java application through caching mechanism.

Caching Mechanism
A cache is an area of local memory that holds a copy of an application data which is expensive to retrieve data from a data sources like the data base or legacy systems.Cached data can includes a result of a query to a database, a disk file or a report.
The cached data is identified by a unique key. The caching mechanism works based on the following simple algorithm
  1. An application requests data from a cache memory using a unique key.
    If that key is present in a cache, it returns the value of the key

  2. Otherwise, it will retrieve data from a data source and put it into the cache as a key-value pair
  3. The next request for the same key is serviced from the cache instead of accessing from the data source

  4. The cached data released from memory when it’s no longer required


In caching mechanism Hash Table, JNDI or EJB provides the way to stores an object in memory and perform object lookup using a unique key when it is required.
But these implementations do not have any algorithms for removing an object from the memory when it’s no longer required or automatically creating an object after expiration.
The following diagrams illustrates, the general structure of cache management system,


Figure1.General structure of Cache Management System

Benefits
  • It reduces frequent accesses to the database or other data sources, such as XML databases or ERP legacy systems

  • It avoids the cost of repeatedly re-creating an objects

  • It shares objects between threads in a process and between the processes

  • It frees up valuable system hardware and software resources by distributing data across an enterprise rather than storing it in one centralized place such as the data tier

  • Locally stored data directly solves the latency issues, reduces operating costs, and eliminates performance bottlenecks


Risks in cachingCaching may consume more memory in application server.
  • It may lead to data in-accuracies

  • In-appropriate caching management algorithm degrades an application performance


Data shouldn’t cache
  • Secure information that other users can access on a Website Personal information, such as account details

  • Business information that changes frequently and causes problems if not up-to-date and accurate

  • Session-specific data that may not be intended for access by other users


Use case scenario
  1. Application cache
    In an Application cache, an application access the data directly from a cache if that data is present otherwise the application retrieves the data from a data source and stores them in a local memory for future use
    This has a complexity to implement an algorithm for object removing.<
    The figure 1 is Illustrates the general structure of Application cache.


  2. Level 2 cache
    This provides the caching services to an object-mapping framework or data mapping frameworks such as Hibernate or iBatis respectively.
    This type of caches hides the complexity of caching logic from the application.

    The following diagrams illustrates, the general structure of level 2 cache management system,


    Figure.2.General structure of Level 2 Cache Management System


  3. Hybrid Cache
    A hybrid cache is a cache that uses an external data source to retrieve data that is not present in the cache. An application using a hybrid cache benefits from simplified programming of cache access.
    For example, Oracle has a caching mechanism.

    The following diagrams illustrates, the general structure of Hybrid cache management system,


    Figure.3.General structure of hybrid Cache Management System


Caching Algorithms
Cache requires heap memory for holding an application data. If these data are not used for a long time, holding these data in cache proves inefficiency. Because the cache capacity is limited,

An object removing from the cache based on the following criteria such as,
  • Least frequently used (LFU),

  • Least recently used (LRU),

  • Most recently used (MRU),

  • First in first out (FIFO),

  • Last access time and

  • Object Size based


Caching Frameworks
Here I listed some of the open source and commercial frameworks which is available in market.
Open Source:
  • Java Caching System (JCS)

  • OSCache

  • Java Object Cache (JOCache)

  • Java Caching Service, an open source implementation of the JCache API

  • SwarmCache

  • JBossCache

  • EHCache

  • ShiftOne

  • cache4j 
  • eclipselink


Commercial:
  • SpiritCache (from SpiritSoft)

  • Coherence (Oracle)

  • ObjectCache (ObjectStore)

  • Object Caching Service for Java (Oracle)


Conclusion
Effectively designed caching improves an application performance, scalability and availability. . The degradation of performance is caused by the overhead of maintaining a cache without benefiting from reduced cost of access to frequently used data.
To avoid the pitfall of the Cache all, only data that is hard to get from a data source.

Monday, November 24, 2008

JBoss Tools for Monitoring and managing an application Performance

New Document
Application Performance Management
APM refers to the methodologies defined within a system to monitor and manage an application’s performance and availability. The APM directly co-relate with customer’s expectation, i.e. Service Level Agreement.APM provides the ability to detect, diagnose, tuning and reports on the application performance and availability issues. Plenty of APM solutions are available to find out the problems from an application, application server, web server, database server, network and other resources.

JBoss org provides the following tools for monitoring, profiling and managing an application to ensure the performance of an application which is running on JBoss application server.
  1. JBoss Web console
  2. JMX console
  3. JBoss Operations Network
  4. JBoss Profiler
  5. Twiddle utility

JBoss Web Console
Web console is an application which is deployed in JBoss server by default.This console provides the following features to monitor and manage an application and as well as a platform.
  1. It displays in Tree view over JMX consoleIt displays build-in and custom JMX MBeans which provides an application performance monitoring and management capabilities. This web console is running on jmx kernel and provides the tree view.
  2. This shows the server environment detailsBy clicking JBoss Management console in a the applet window shows following,
    • Server installation directory
    • Configuration details
    • Server version
    • # of CPU’s
    • Operating System and
    • JVM Memory usage
  3. JBoss Server summary view
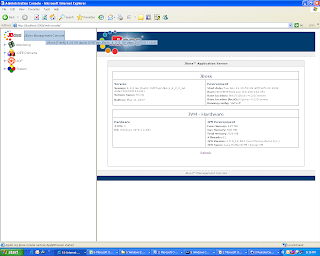
  4. Form this console ,you can monitor the web server statistics Web status view has two views
    1. Connector Scoreboard viewThis has the details about JVM Memory usage and thread pool usage
    2. Web status view window
    3. Full status ViewThis provides the JVM memory usage, thread pool usage and session details for each applications
    4. Full Status View window
  5. It can be used to view J2EE domains details and J2EE resources related metrics
  6. It shows the classes and unbound bindings (i.e. point cut expressions for each aop) under AOP node
  7. JBoss administrator can subscribe an alert. Alert can be a mail/console alert
  8. Provides the runtime graph for monitoring an application performance
  9. It captures the snapshot / historical data for a configured resource
Useful JMX MBeans to monitorWeb console lists the JMX MBeans in Tree view. By default, JBoss exposes the MBeans for monitoring and managing an application and as well as platform’s performance You can create your own custom MBeans. You can use the following JMX MBeans to manage an application/platform
  • Java.langThis exposes the Memory pool usage, Garbage collection details, Class loading details, compilation details, operating system details, Swap space size, committed virtual memory size, Physical memory size, Runtime details and Thread usage details
  • jboss.cacheThis exposes the details about cache read, write, hit ratio, elapsed time, evictions and etc
  • jboss.jcaThis MBean enable you to view JCA connection pool usage It allows to edit the configuration details without restarting the server
  • jboss.mqThis service provides the facility to monitor mq message cache, JMS Pool, Thread pool and etc
  • jboss.mq.destinationThis MBean service exposes the queue details for each destination
  • jboss.systemThis shows the server environmental details, sever memory usage details and server thread pool usage details
  • Jboss.webThis exposes some of the following metrics for each application which is deployed in server.
    • Cache usage,
    • Class loader and class loading
    • Thread pool usage (example mod_jk,HTTP 8080)
    • Connector details(example HTTP,RMI)
    • Request processor details

Enabling runtime Graph
To enable the runtime graphs for monitoring the resource usage details, do the following steps.
  1. Go to JMX MBeans view under System
  2. Select an MBean which wants to be monitor
  3. Expand the tree for a selected MBean
  4. Right click on a property which wants to be monitor and select “graph” option from a drop down list
  5. JBoss management console's runtime graph
  6. You can do the following activities in runtime graph
  7. Change chart properties
  8. Save as image
  9. Print
  10. Zoom in and zoom out
Note: Either you close or refresh your web console page; these graphs also be closed automatically.
Creating Snapshots
JBoss creates the snapshots for storing historical data for a selected MBean property.To create a snapshot, do the following steps.
  1. Go to JMX MBeans view under System
  2. Select an MBean which wants to be monitor
  3. Expand the tree for a selected MBean
  4. Right click on a property which wants to be monitor and select “create snapshot” option from a drop down list
  5. Enter the Time Period value for how often threshold should be tested.
  6. Click on Create button to create a snapshot
  7. Create Threshold MBean Monitor window
Creating an Alert
JBoss management console provides two types of alerts
  1. Mail AlertJBoss mailer sends a mail alert to admin when a monitor exceeds the threshold valueThe mail server and other configurations are available at mail-services.xml file which is deployed at deploy folder.
  2. Console AlertThis type of alert sends an alert message to “JBoss Management console -> Monitoring -> Monitoring Alerts” view
To create an Alert, do the following steps
  1. Go to JMX MBeans view under System
  2. Select an MBean which wants to be monitor
  3. Expand the tree for a selected MBean
  4. Right click on a property which wants to be monitor and select “create monitor” option from a drop down list
  5. Fill the following fields
    • Monitor name -> the name of the monitor and how it will be references within web console
    • Threshold value-> the value that will trigger an alert when the Comparison Equation is reached for the attribute value
    • Time period -> how often should threshold be tested
    • Comparison equation -> Boolean expression to use when testing threshold hit
    • Persisted -> should this monitor be created for next JBoss reboot?
    • Enable Monitor -> should this monitor be enabled
    • Alert Type -> Alert Listeners to trigger
  6. Click on Create button to create an alert
  7. Now monitor is running, it will send an alert message when the alert condition satisfied
  8. Create Threshold MBean Monitor window
JBoss jmx-console
JMX console is a web based jmx agent. This jmx agent view contains the following,
  • List of JMX MBeans,
  • Under the selected MBean, it shows MBean description, list of MBean attributes list of MBean operations.
  • This console allows you to modify the configuration parameters without restarting the server instances.
  • Sample diagram of JMX Agent view window
  • Sample diagram of JMX MBean detail view window

JBoss Profiler
JBoss profiler is a log based profiling tool. This tool is tracing the events from the JVM and writes them into disk in log format using JVMPI system. It uses an agent which is written in c language for tracing events.After you have configured the parameters into the JBoss profiler, the profiler will not start/stop profiling automatically.
Profiler has the following features
  • No need to send a data through an open port, breaking firewall rules between profiler and JVMPI/JVMTI.
  • Profiler can be run easily through your web browser.
  • It extracts the events for
    1. method entry/exit (CPU and Time)
    2. object allocation(Memory usage)
    3. thread start/end(Thread Usage)
    4. class loading
    5. object release(Garbage Collection)
  • It uses the interceptors for capturing the log and process those files after the test case, scenario has finished.
  • You can start / stop profiling when you need it.
  • Sample snapshot for method stack Chart which is taken from JBoss profiler chart
Twiddle utility
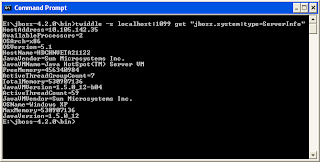
JBoss provides simple command line execution utility for interacting with remote jmx server instance.i.e called twiddle. This utility is shipped with jboss bin directory as twiddle.bat or twiddle.sh.
Example:To get the free memory from jboss.system MBean use the following commandTwiddle –s localhost: 1099 get “jboss.system:type=ServerInfo” FreeMemory
Sample Output Window

For more information about twiddle type twiddle –h command from a command prompt under jboss bin directory
References:-
  1. For profiler related information click here
  2. For twiddle related information click on here